Children’s Fitness Testing in Primary Schools
Premier Education partnered with ukactive to conduct a study that examined the impact of physical activity on children.
Introduction to study
The health and fitness of children are increasingly recognised as a key component of public health. Two reasons for this growing emphasis are evident:
- Poor health adversely affects the quality of life, and the physical, academic and social development of children.
- Poor health in childhood may lead to certain diseases and is often predictive of poor health in adulthood.
Challenges
Children’s fitness levels have been decreasing between 7-9% every decade. Therefore, public health agencies in the UK are encouraging innovative programmes to increase levels of childhood physical activity. However, there is a widespread lack of routine health data which means it is problematic to evaluate the true impact of these programmes. This also means it is almost impossible to set benchmarks, to identify local pockets of excellence/underperformance, or to estimate cost-effectiveness. While many areas of public health policy are characterised by a clear evidence-based strategy, for example stopping smoking, decisions relating to the health and fitness of the nation’s children are arguably often made without evidence.
The UK Chief Medical Officer stated, “The introduction of a standardised school-based fitness assessment in England may have multiple benefits that extend beyond the benefits for the individual”. Such benefits include increased physical activity among this group in real-time, leading to lifelong increases in physical activity habits, reduced lifetime risk of disease, higher educational attainment, and improved social and mental wellbeing.
The National Child Weight Measurement Programme (NCMP) provides valuable data at a local and national population level which can be used to track trends over time and importantly lead to conversations with children and families around healthy lifestyles and health behaviours. However, BMI is calculated from height and weight and is therefore at best a weak representative measure of a child’s health (i.e., tall thin children are associated with low BMI scores but might be inactive and unhealthy, while short stocky children are associated with high BMI scores but might be active and healthy).
BMI has therefore been criticised as being a crude measure of a child’s current and potential health status. Perhaps most importantly given the biomedical and economic realities of contemporary healthcare, relationships between childhood BMI, physical activity levels and subsequent adult health status are weak. It has been argued that to gain a true insight into the health and fitness of the UK’s children, a more valid approach is required.
Arguably a more useful measure would be cardiorespiratory fitness (the ability of the body’s circulatory and respiratory systems to supply fuel and oxygen during sustained physical activity). Cardiorespiratory fitness is a validated marker of physical activity which also predicts adult physical activity and health status to a greater degree than BMI. It has been proposed that by measuring cardiorespiratory fitness among primary school children not only would it be possible for each child/parent to assess fitness and monitor changes over time, it might also increase physical activity engagement of families. By formalising such an assessment, awareness of physical fitness as an area of health importance would increase throughout the population. This may provide a stimulus for a culture change that many believe is desperately needed.
It is not only important to seek to measure the cardiorespiratory fitness of children, but also to identify the best test by which to do so. If the cardiorespiratory fitness of school children is to be routinely measured, we need to acknowledge that appropriate testing protocols are almost certainly less scalable than the NCMP, and at least start with the most promising test. A recent systematic review by the ukactive Research Institute examined the scalability of children’s fitness tests and concluded that the 20m shuttle-run test was the most scalable, which is equivalent to Premier Education’s My Personal Best Challenge.
Aims of this study
- To investigate the cardiorespiratory fitness among primary school children and to provide an indication of change over time (12 months) in cardiorespiratory fitness and BMI
- Provide an indication of the degree to which deprivation levels impact upon cardiorespiratory fitness and BMI.
- Provide an indication of the feasibility of the testing protocol as evidenced by parental opt-in rates and pupil enjoyment.
See end of page for methodology (including participants, ethics and confidentiality).
Procedure
Children completed a 20m shuttle-run test once during the Autumn 2014, Spring 2015, Summer 2015, and Autumn 2015 school terms. This included data collection either side of the school summer holidays. The testing sessions and data collection were conducted by appropriately trained and qualified personnel already operating in the schools and not by the research team, although the latter vetted this process.
Measures
- BMI
- BMI (Body Mass Index) is calculated using height (measured to the nearest centimetre) and weight (measured to the nearest 0.1kg). BMI is an index used to indicate whether a person is over or under weight.
- To compare the results to national data z-scores were calculated. A z-score is an indication of how far results are away from the average. Compared to the average score for children of the same age and sex, a positive z-score indicates a higher than average test score, a negative z-score indicates a lower than average test score, and a z-score of zero indicates the test score is equal to the average.
- BMI z-scores specific to age and sex were calculated using UK 1990 growth reference data which allowed for a direct comparison between males and females and different ages. International Obesity Task Force (IOTF) classifications were then established which provide a grade based on BMI.
- Fitness
- The children completed 20m shuttles starting at a speed of 8.5 km/h increasing by 0.5 km/h each minute. An audible signal indicated when a participant should complete each shuttle. The final shuttle was recorded once a participant failed to maintain the audible controlled pace or stop due to exhaustion.
- Age- and sex-specific z-scores were calculated to provide a comparison between participants of different ages and sexes within the sample.
- To demonstrate the impact of Premier Education’s My Personal Best Challenge the fitness results are compared to a control. The control did not receive input from Premier Education besides the data collection for this research. To compare the intervention fitness is calculated as VO2 max which is the maximum rate oxygen is used by the body during exercise, a measure of cardiorespiratory fitness.
- VO2 max is reported as both relative (the number of millilitres of oxygen used per minute per kilogram of body weight) and absolute (the total litres of oxygen per minute). Both are reported to demonstrate the impact of body weight on the results.
- Measure of Deprivation
- Each school was assigned a deprivation rank based on the Lower-layer Super Output Area in which the school is situated. Deprivation was calculated using the English Index of Multiple Deprivation 2015, the official measure of relative deprivation for small areas in England.
- Statistical Analysis
- Statistical analysis was completed on the data to determine differences in Fitness and BMI z-scores among the four time points. Further analysis was conducted to understand the effect of school deprivation quartile rank on Fitness and BMI z-scores.
- Additional statistical analysis was completed to compare the difference between the intervention (those that received Premier Education input) and the control (those that did not receive Premier Education input).
Results
IOTF classifications are reported in Table 1. These indicate that most children were classified as normal weight over the four time points. Autumn 2015 saw the lowest percentage of normal weight children and the highest percentage of overweight children; however, the percentage of obese children at this point in time was lower than Autumn 2014.

Statistical analysis results determined that mean BMI z-score differed statistically between time points with further analysis revealing that BMI z-scores were lower in the Spring 2015 compared to Autumn 2014. There were also increases in BMI z-score from Spring 2015 to Summer 2015. BMI was highest in Autumn 2015.
For the Fitness z-scores, statistical analysis determined that there were statistically significant differences between time points. Further analysis revealed that fitness z-scores increased from Autumn 2014 to Spring 2015. There was also a decrease in fitness z-score from Spring 2015 to Summer 2015, and Summer 2015 to Autumn 2015, the summer holiday period.
Data are presented in Tables 2, 3, and Figure 1

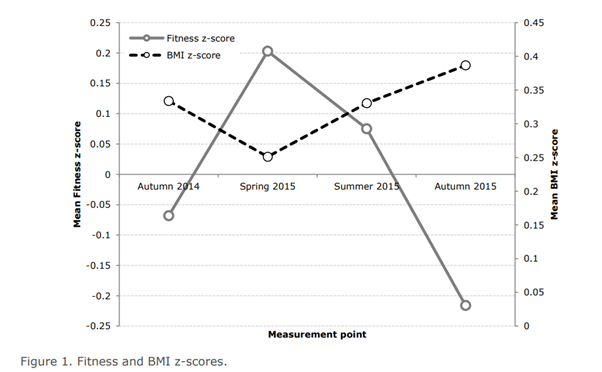
Table 3. Further analysis to show between which time points there were differences.

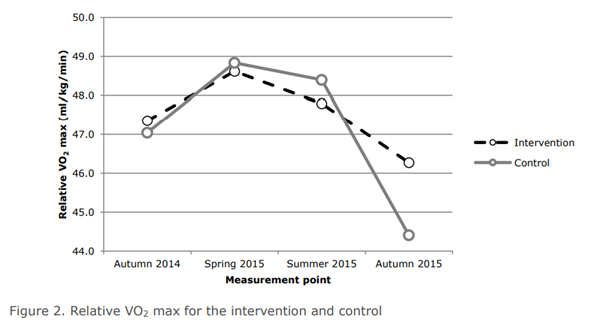
To demonstrate the impact of Premier Education’s My Personal Best Challenge the fitness results are compared to a control. For the relative VO2 max Figure 2 shows that fitness increased from Autumn 2014 to Spring 2015 before decreasing at both Summer 2015 and Autumn 2015. Although fitness reduced over the summer holiday period, those receiving the Premier Education intervention did not see a reduction in fitness as large as those who did not.
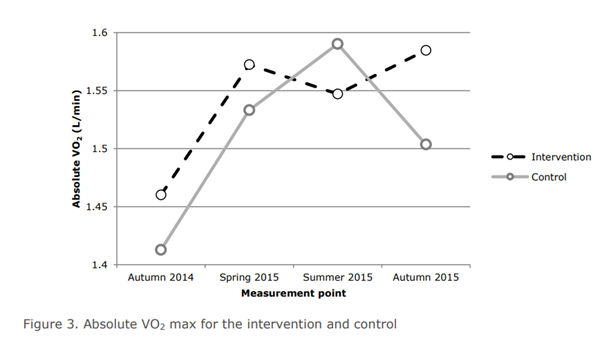
If weight is removed from the calculation to produce an absolute VO2 max we can see different results in Figure 3. There was an increase from Autumn 2015 to Spring 2015, however the control also increased at Summer 2015 whereas the intervention reduced slightly. Importantly however the intervention then showed an increase across the summer holiday period with the control reducing.
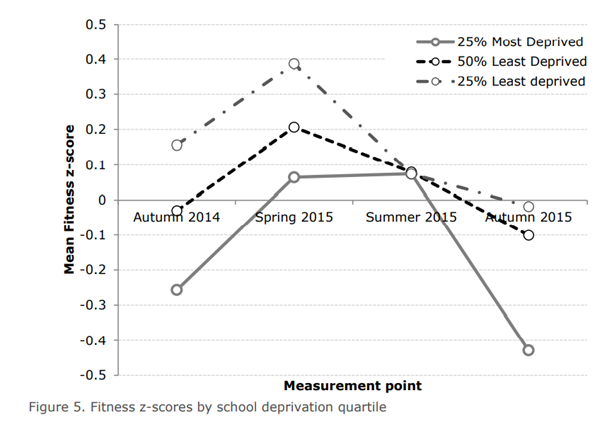
Deprivation
The English Index of Multiple Deprivation rankings of Schools have been divided into four groups. The comparisons relate to the whole of England, for example if a Lower-level Super Output Area within which a school is located falls into the 25% most deprived group, it is within the top 25% of deprived Lower-level Super Output Areas in England.
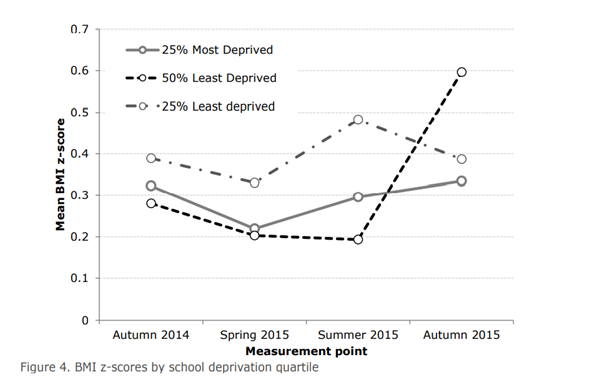
Fitness z-scores demonstrated a statistically significant effect of deprivation group. Further analysis revealed a statistically significant difference in fitness z-scores between schools located in 25% most deprived group and the 25% least deprived group.
For BMI z-scores there was a no significant main effect of deprivation group indicating deprivation levels of the area surrounding the schools had no effect on children’s BMI z-scores levels.
Data are presented in Figures 2 and 3.
Discussion
The physical activity levels and fitness of school children is increasingly a public health issue. Cardiorespiratory fitness is a validated marker of physical activity levels, however there is little regular measurement of this variable in school children. Regular measurement would allow all stakeholders, from parents and schools to activity providers and public health agencies, to monitor changes in cardiorespiratory fitness over time and to evaluate the effectiveness of programmes.
The primary purpose of this research was to examine the fitness of children at a number of UK primary schools over one academic year. Measures were fitness and BMI. Secondary aims were to test the feasibility of fitness testing in primary schools more generally.
Comparison results indicated differences in fitness between the Premier Education intervention and control over time. This comparison between the Premier Education intervention and control group reveals that even though when the data is normalised by including the weight of the participant those children who followed the Premier Education intervention were fitter than those who did not after 12 months.
Results indicated significant differences over time for fitness and BMI z-scores throughout the school year. Further analysis revealed that fitness increased significantly between Autumn 2014 and Summer 2015, before decreasing significantly between Summer 2015 and Autumn 2015 i.e. the school summer holiday period. Fitness levels decreased dramatically over the summer holidays to below the beginning of the previous year. This effect was compounded by the deprivation group within which the schools were situated. Those schools in the poorest areas saw significantly greater reductions in fitness levels over this summer period than those from more affluent areas.
These findings have stark implications for policy makers and those responsible for the health and wellbeing of children. Firstly, from a positive perspective, data suggest that school based physical activity delivery programmes and investments are positively impacting upon the fitness levels of children during the academic year. Worryingly however, these improvements are eradicated during the summer break. Although this seems counterintuitive i.e. children are less active during the summer / holiday period, it is consistent with previous findings from the US, and is anecdotally supported by statements from parents in the present study. The latter specifically suggest that accessible opportunities to keep children active are hard to come by during long school holidays and can often be unaffordable or difficult to manage around working hours. The fact that the effect is so profound in those children attending schools in the poorest areas supports the need for investment in opportunities for children and parents that both promote an active summer period, but that are also built around the needs of working parents and affordable (ideally of course, free of charge).
The data are relevant in the context of the increased investment being allocated to childhood physical activity and sport in recent policy documents (Department of Health, 2016). This includes the allocation of funds raised via a soft drinks levy (estimated to be £350 million) to be invested into school sport – when perhaps there may be a case for this to be directed to activity outside of the school gates, further research is required. Data also indicate that the delivery of cardiorespiratory fitness testing in primary schools is feasible and scalable. No parents / guardians in the present study refused to provide consent for their child to take part in the investigation and complete fitness measurement protocol. Further, when surveyed, only one child recorded not enjoying being part of this process.
Conclusion
The present study suggests that the regular measurement of children’s cardiorespiratory fitness is both feasible and scalable. The results are able to inform policy positions and the allocation of funding into programmes targeting the physical activity of primary age children. Results also highlight dramatic and significant reductions in children’s fitness levels over the summer holiday period – an effect which is significantly more apparent among children from the most deprived areas. However, the decrease over the summer holidays was not as dramatic for those children who were part of the Premier Education delivery.
Method
Participants. A total of 409 children aged between 9 and 10 years of age took part in the study. This was made up of 222 males and 187 females, with an average height of 1.32m and weight of 30.75kg, and from a total of 13 schools in the North West of England. The children were recruited through their schools’ involvement, and those schools were themselves recruited via National Teaching Schools in the local area and via existing links with Premier Education.
Ethics and confidentiality
Consent was obtained from schools and then subsequently from parents/guardians of all potential participants. This is a model that has been developed through consultation with Public Health England and the Office for Standards in Education, Children’s Services and Skills (Ofsted). Any paper files were stored in locked cabinets within the schools, and electronic files stored on password-protected computers, in both cases in accordance with the Ofsted information governance team. All files were destroyed upon completion of the investigation. Data were anonymised when transferred to research team, and stored on password-protected computers.
Inclusion criteria
In the present study, all testing was completed by service delivery staff, who were delivering PE lessons and other extra-curricular physical activities in schools. All staff were employees of Premier Education , a PE provider who operate in over 3,000 schools throughout the UK and who deliver over 20,000 PE sessions each month. The 20m shuttle-run test is an exhaustive protocol, and children were required to run until they could no longer keep pace with the automated ‘bleeps’. This was voluntary and the children were free to stop at any point during the test. Risks were moderated by the fact that the coaches were experienced in the delivery of such sessions and that fitness tests were incorporated into wider PE class that included fun and accessible activities. Even so, during training for the study it was made very clear that at no point should coaches be overly encouraging to the children or use any inappropriate or disparaging communications towards those who either are not actively trying to complete the protocol or are struggling to do so (the voluntary/organic engagement of participants is a key metric in the study). This was also covered in sport checks conducted by members of the research team and discussed in interviews with teachers following testing.

